The network as a vascular tree — 15 centers, 9 states
Each node is a center: sized by patient volume, coloured by median referral-to-procedure days. Branch width = group volume.
≤ 10 days11–14> 14 days
1
Patient volume and referral-to-procedure time — 24 months
Bars: patients treated per month (selected period highlighted). Line: volume-weighted median days from referral to procedure.
In periodPriorDays to access
3
Procedures by family
Encounters in period, share of total.
4
Revenue cycle by center group
Charge lag (days from procedure to charge posted), first-pass denial rate, days in A/R — volume-weighted.
on targetwatchaction
5
Procedure-room utilisation by center
Staffed room-hours used ÷ available. Target band 78–88%.
6
Patient experience by center
Post-visit survey: % satisfied and Net Promoter Score on an 80–100 scale, ranked by NPS.
Satisfied %NPS
7
Ask the data
Natural-language layer over the same model — answers cite the panel they came from.
Try alsoDenial rate by payer, Georgia, last quarterThrombectomy volume vs same month last yearWhich rooms are idle on Fridays?
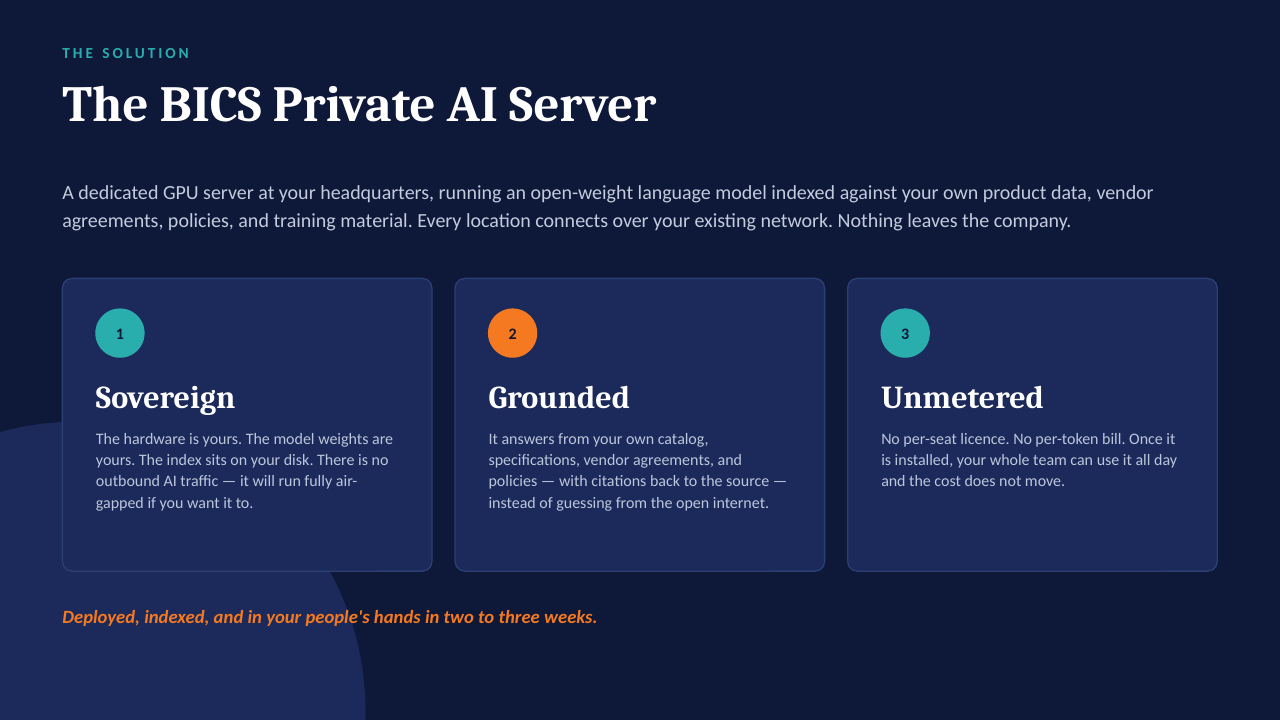
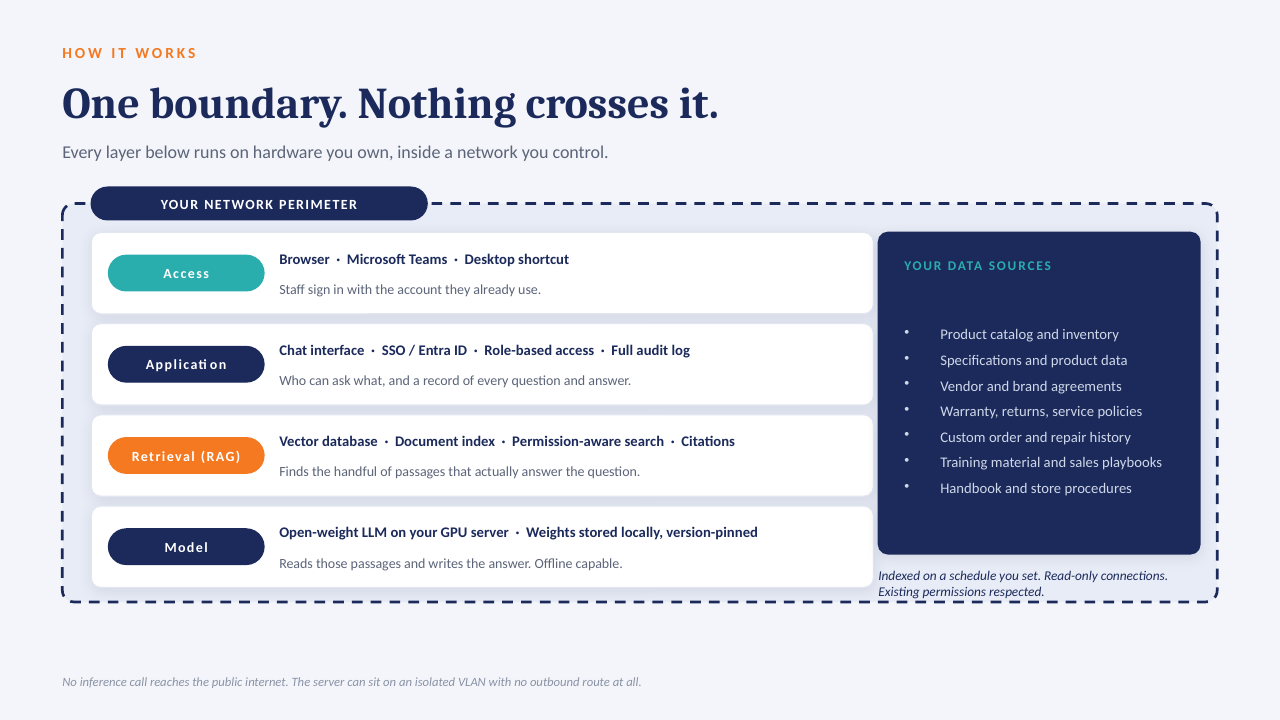
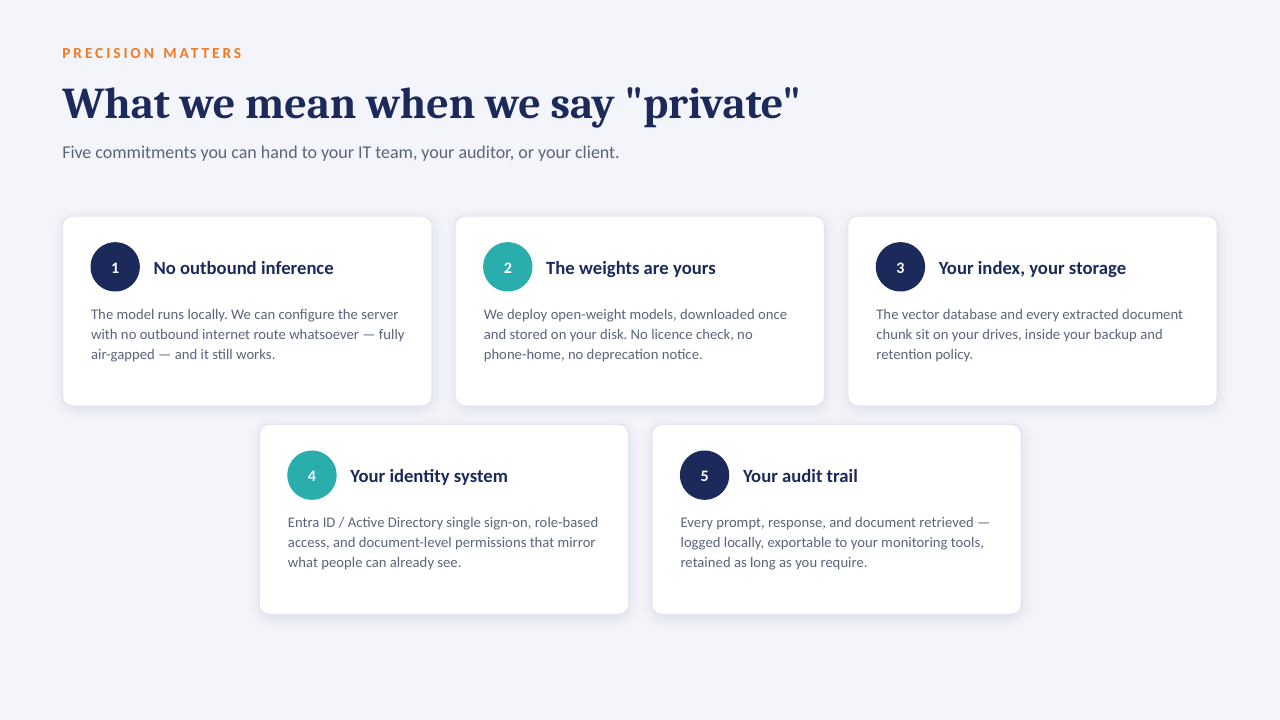
Model: private, on-premise LLM over the Power BI semantic model · no PHI leaves the network · answer generated from the same filtered dataset shown above.
8